Pinterest content strategy seems pretty simple: pick a pretty image, add a description, and there you go. The fact is, Pinterest is a visual search engine. Pinterest does not work like Instagram. Pinterest does not work like Facebook, or Reddit, or whatever other social media platform you use.
Pinterest is built around understanding what an idea is and who it should the idea be shown to. Pinterest itself calls the platform a “catalogue of ideas”, meaning that discovery depends on relevance and context as much as aesthetics.
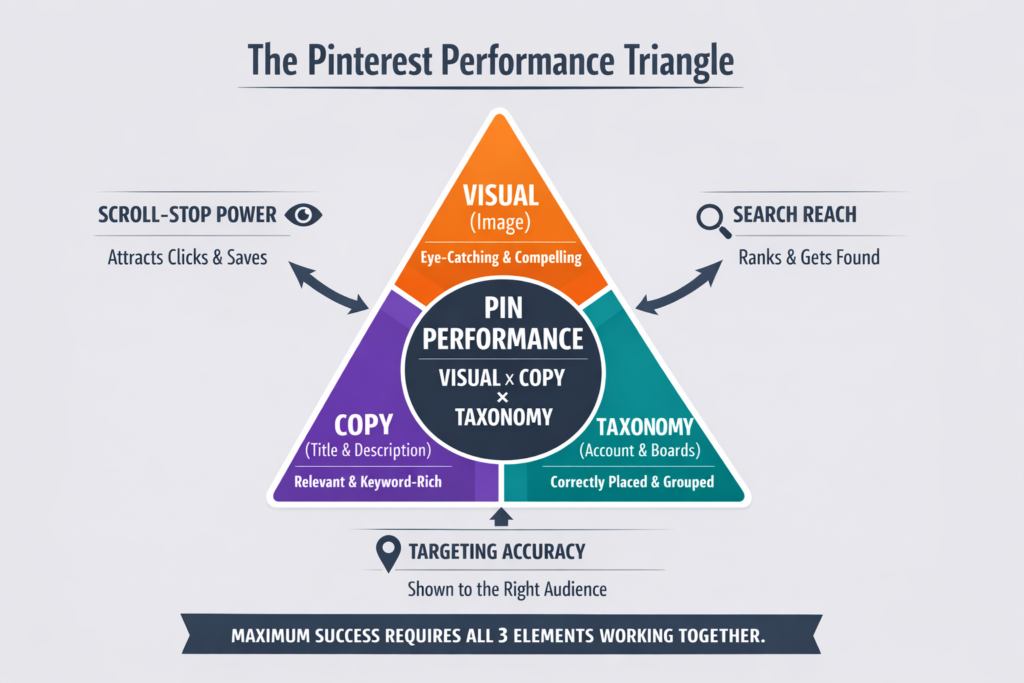
This is why we came up with the Pinterest Performance Triangle (or PPT).
The Pinterest Performance Triangle is like an equation, but simpler to understand, aka: PPT = Visual + Copy + Taxonomy.
The Pinterest Performance Triangle reflects how Pinterest’s systems actually evaluate your content. You may ask…how so? Thank you for asking 🙂 … let me walk you through it…
How Pinterest Use Visual Signals from Pins
Visual signals are straightforward because the first thing people see is the pin image. And clear, high-quality visuals that represent their topic are more likely to be understood and surfaced appropriately by the platform’s machine vision systems.
In fact, Pinterest is a visual discovery engine where images are central to search and inspiration. That means the system reads images with sophisticated deep learning models to determine what ideas they represent and how they connect to billions of other images on the platform.
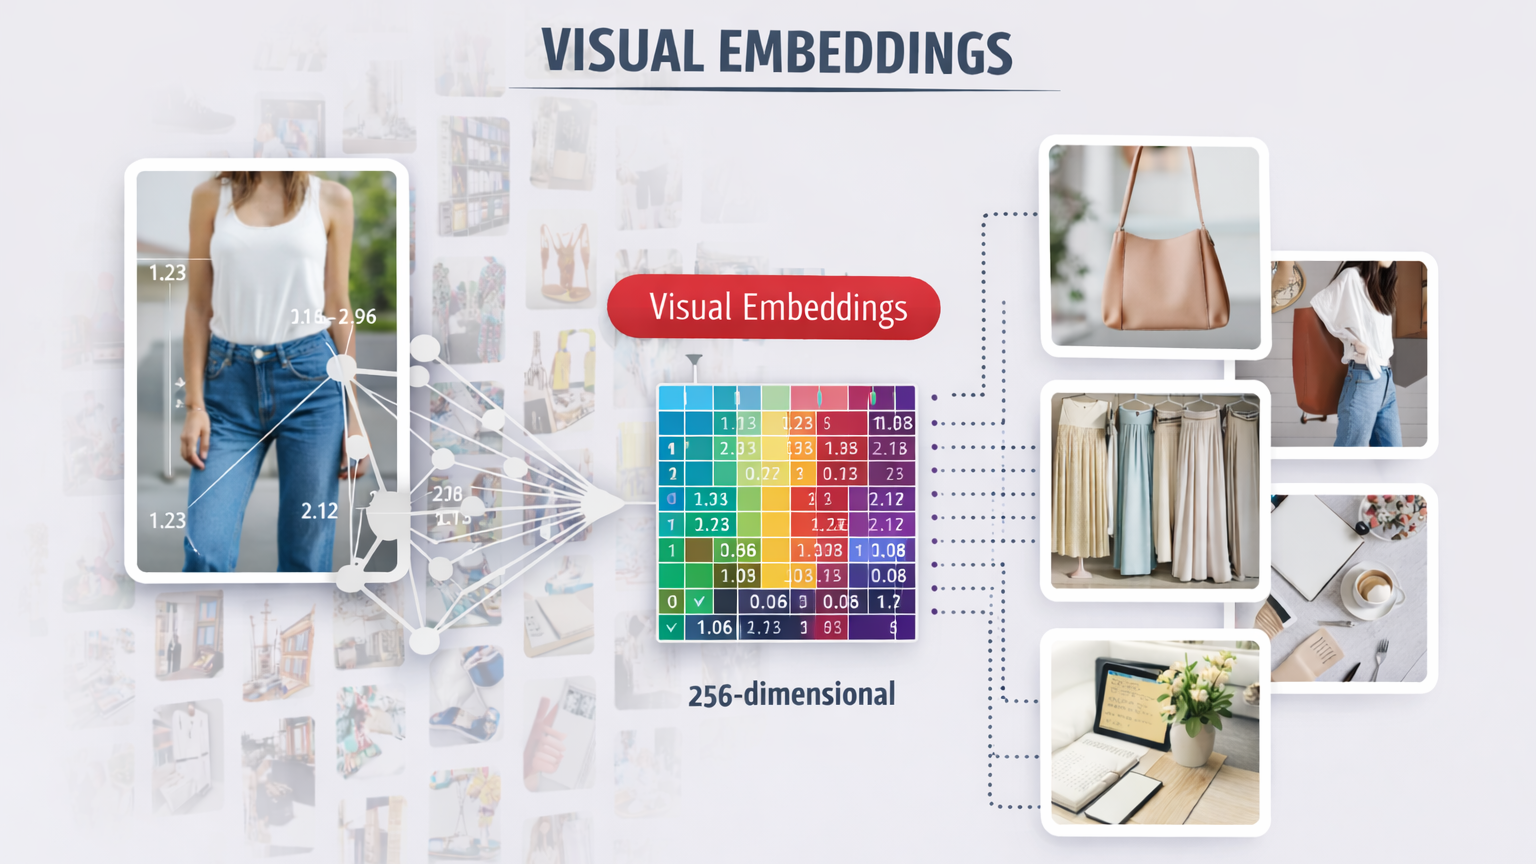
Visual embeddings are at the heart of Pinterest visual engine. Embeddings are numerical representations of images learned by Pinterest’s machine learning systems that capture patterns like shapes, styles, colors, and objects. These embeddings let the system compare any given image against billions of Pins and return visually related content in a fraction of a second. Pinterest has evolved these embeddings over years, initially powering things like the visual cropping tool and later powering advanced discovery features like Lens and object search.
This investment in visual AI influences and drives real user behavior. Pinterest reported that visual search experiences such as Lens and similar object detection features are used millions of times per month as Pinners explore ideas directly through images rather than text. Users can Complete The Look (CTL) by tapping on any part of a Pin and immediately see related visual content. This process involves A LOT of data modeling and image understanding in the background, but in the end it gets it, aka it helps you pick that cool look for a thursday night dinner with co-workers!
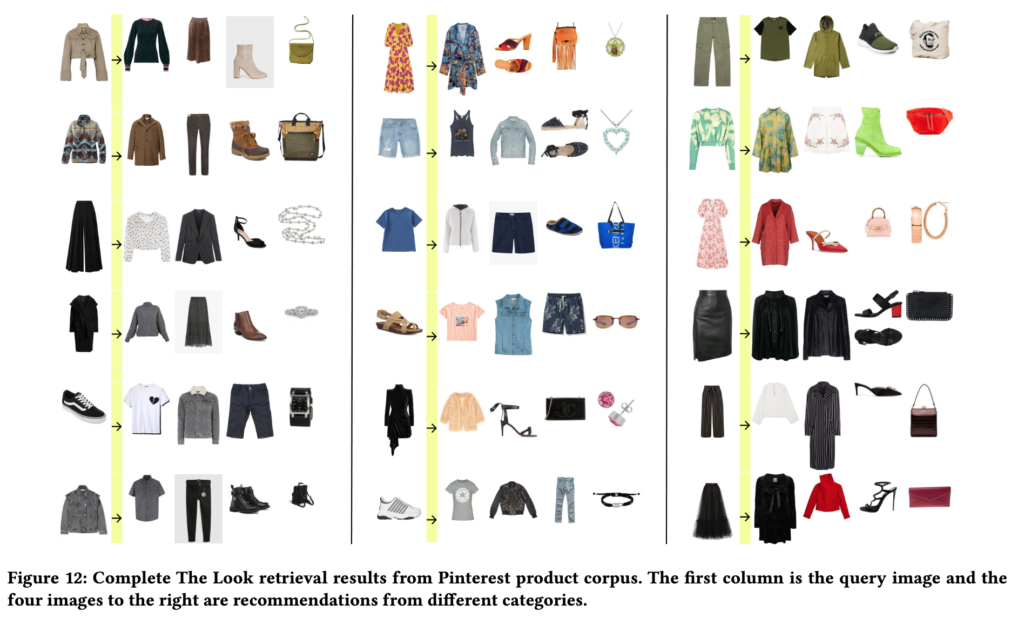
“Putting together an ideal outfit is a process that involves creativity and style intuition. This makes it a particularly difficult task to automate… This technology aims to learn the subjective task of ‘style compatibility’ in order to recommend complementary items that complete an outfit.”
Li et al., Bootstrapping Complete The Look at Pinterest, KDD 2020
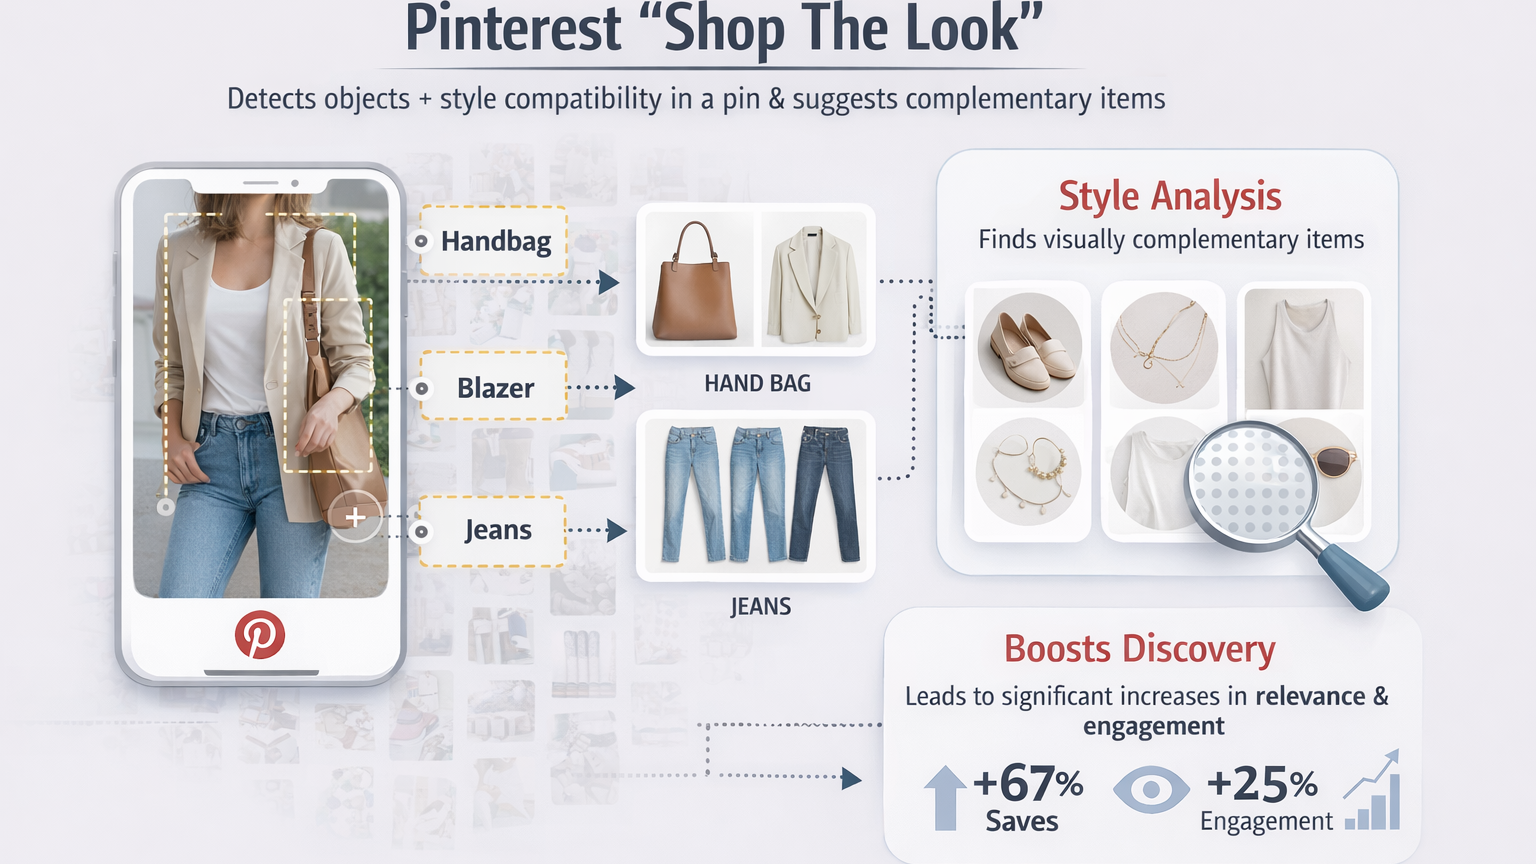
Pinterest’s visual discovery engine also trains models to detect objects within images and even style compatibility, and this is the technology behind tools like Shop The Look that identify fashion items and recommend complementary visuals. These systems have been shown in published research to significantly improve relevance and engagement, demonstrating that deep visual analysis materially affects what content users actually look at, and click on, next.
What all this shows is that Pinterest’s infrastructure treats images as first-class fulfillment signals. A pin’s image is not just what someone sees — it’s what Pinterest uses to decide whether that pin should appear in visual search results, related suggestions, and recommendation surfaces.
If an image lacks clarity, recognizable features, or alignment with how Pinterest’s models interpret visuals, it can get less distribution because the system struggles to place it confidently within its massive idea graph — even if the accompanying text is perfect. That’s why your best chance to rank on Pinterest requires high-quality visuals related to highly ranking pins.
WordPin tackles this with the Visual Pin Modeling tool, that allows you to model any pin by generating high-quality Pinterest-optimized visual content that align with Pinterest’s perception models.
Start your 7-day FREE trial with 200 credits to test it out!
When you combine great visuals with strong copy and thoughtful taxonomy, you make Pinterest’s visual engine very happy, nailing the Pinterest Performance Triangle!
Copy: Why a Pin’s Title and Description Matter
Pinterest engineers use search relevance to align a user’s query with the content Pinterest believes best satisfies that query. Behind the scenes, Pinterest’s search ranking models look for a rich set of text signals: pin titles, descriptions, image captions, and even historically high-engagement query tokens associated with a given pin.
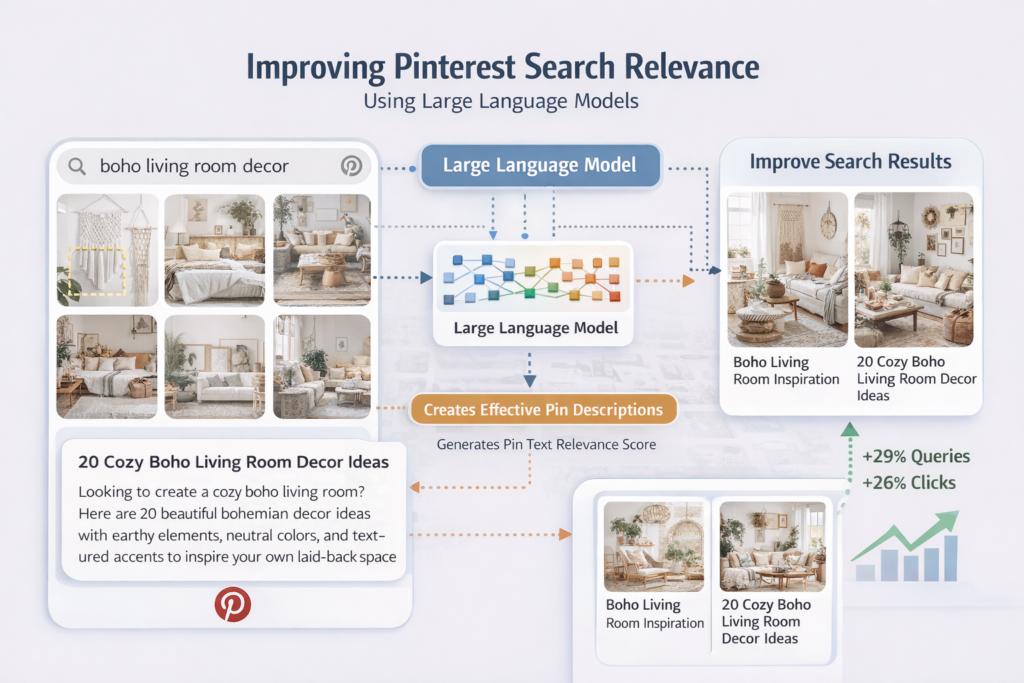
Pinterest’s engineering team published a post entitled “Improving Pinterest Search Relevance Using Large Language Models“, where they explain how text signals are used to predict what users want. Titles, descriptions, and alt texts are combined in large language models trained on human-annotated relevance data to predict how well a pin actually matches what users ask with a specific search phrase/keyword. This is learned from billions of logged search interactions every day.
That might sound abstract, the implication is very concrete: Pinterest treats your text content as a key signal for understanding what your pin is and what problem it solves. Titles and descriptions are key in how Pinterest ranks search results. This model correlates text with search queries, user engagement history, and visual features to decide which pins get to the top of a search results page.
Pinterest also works a lot with annotations, aka small keywords or phrases automatically extracted from a pin that describe its subject. Pinterest reported that these annotations, often just one to six words long, are used across multiple ranking subsystems, like search retrieval, related pin suggestions, and home feed ranking.
Pinterest maintains an internal vocabulary (often cited as numbering in the tens of millions of distinct interest terms) that it uses to categorize and match content against search queries The presence and confidence of these extracted keyword features contribute to how Pinterest’s machine learning models perceive relevance and context.
What this means for you, and all other Pinterest creators, is quite simple: if your title and description aren’t clear and aligned with Pinterest keywords, Pinterest has to guess what your pin is about. And that’s not good because it cannot match your content to search intent…aka, your pins aren’t going to rank and are not going to be shown to users.
WordPin makes Pinterest-relevant copies with keywords-enriched Pin titles and descriptions,
optimized for your topic/keyword to tell Pinterest what your pin is about.
Start your 7-day FREE trial with 200 credits to test it out!
Pinterest’s models are trained on billions of search data, and relevance is measured on a five-level scale (from highly relevant to irrelevant).
In other words, signals from text are core features in the ranking models that decide whether your pin appears near the top or near the dustbin of search results.
So, Pinterest engineers use search relevance optimization to encode meaning in a way that the platform’s large-scale models can reliably interpret and use. That’s why titles and descriptions that align with actual Pinterest search vocabulary have a driect and measurable impact on a pin’s discoverability.
Pinterest Taxonomy: Categories That Matter
Pinterest taxonomy is like the misunderstood and forgotten child prodigy…in lay terms that’s the invisible structure that makes everything else in discovery possible.
Pinterest organizes billions of pieces of content into a hierarchy of interests and topics. When a user looks for “fall outfit ideas” or “DIY home projects”, Pinterest maps those terms to main family of terms, aka taxonomies. To do that, Pinterest engineers built what they call an Interest Taxonomy.
Source: Interest Taxonomy: A knowledge graph management system for content understanding at Pinterest (Medium, Jan 2020)
Pinterest Interest Taxonomy is a hierarchical (knowledge) graph of concepts like “Women’s Fashion,” “DIY and Crafts,” and more, each with up to 11 levels of granularity (aka lower levels) underneath it. This graph maps how ideas relate to one another and lets Pinterest’s systems reason about where content belongs in the broader idea landscape.
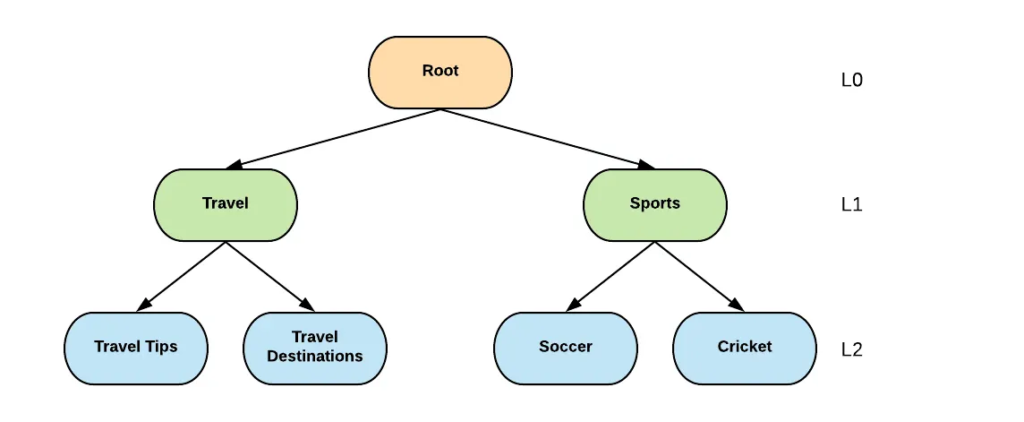
In the image above each box is a node and each arrow is called edge. Travel and Sports are considered parent nodes. Travel Tips and Travel Destinations are children nodes and Travel is their parent. Similarly, Soccer and Cricket are children nodes and Sports is their parent node.
The Root node is where everything starts from, that’s why it’s labeled with L0. Each lower level (nodes in green and blue) is then counted sequentially and that’s they they are also labeled as L1 and L2, respectively.
Now, how does Pinterest manage to do that at scale? The mind behind that is a pipeline called Pin2Interest (P2I).
What P2I does is to that takes inputs from anywhere, aka visual embeddings, text signals, board names, and other metadata, and maps every pin to one or more taxonomy nodes. Pinterest engineers report that more than 99 % of pins can be reliably mapped to at least one taxonomy node. When a pin’s text and image align strongly with a specific interest node, the system generates a score that indicates how well that pin relates to taxonomy XYZ, affecting how, where and if a pin is shown to users.
When Pinterest maps a user’s interactions (searches, saves, clicks via User2Interest (U2I)), that ties the user’s intent to the same taxonomy nodes your pins are tagged with. This means that Pinterest sees a user interest profile, a pin profile, and a matching layer between them created through the assigned taxonomy. Because of this, content that genuinely belongs to a tightly defined niche within the interest graph is far more likely to be surfaced when users are exploring or searching within that niche.
In engineering terms, this taxonomy is what turns isolated signals (title text, board names, visual features) into contextually rich representations that can power both search relevance and recommendation ranking.
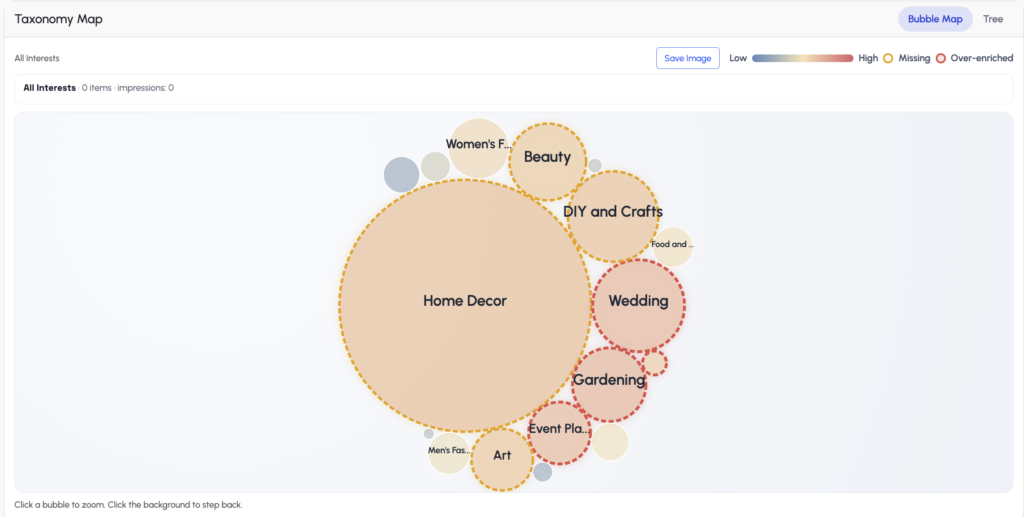
WordPin’s Pin Taxonomy Map tool helps users see what taxonomies they covered, and which ones they are missing.
Efficient use of Pinterest’s taxonomies helps Pinterest better understand and place your pins.
Start your 7-day FREE trial with 200 credits to test it out!
This is also why boards and their names matter more than most creators realize. Boards are semantic anchors that give Pinterest’s taxonomy models extra context about what your content is about, especially when paired with consistent pin titles and descriptions. Every time a pin lands on a board that’s tightly themed, Pinterest is more confident about where that content should sit in the interest graph and who should see it.
WordPin’s Pin Taxonomy Map is built around this very reality. Instead of leaving your content’s placement in Pinterest’s interest graph up to chance, our tool visualizes where your pins and boards are mapped within the taxonomy, highlights gaps between your intended topics and your actual signals, and gives you actionable insight on how to restructure boards and pin contexts so the platform’s classification systems can place your content correctly and confidently. When visuals, text, and taxonomy all point to the same nodes within the interest graph, Pinterest’s systems stop guessing and start trusting your content — and that’s when distribution and engagement begin to scale.
Conclusions
A cool pin image and a nice copy may get your pin into the running for impressions, but taxonomy is what tells Pinterest where to show it. The Pinterest Performance Triangle (PPT) sits at the intersection of all these signals and WordPin helps you work with all of these metrics.
These three elements are multiplicative:
A compelling visual without relevant keywords may be seen but not found. A keyword-optimized description with a blurry or unrelated image may be indexed but not clicked. And without sound taxonomy, clear board structure and account context, even excellent pins can fail to reach their best possible audience, because Pinterest isn’t too confident about who should see them.
When visuals, text, and taxonomy work together, your pins stop being random shots in the dark and start becoming predictable drivers of discovery and engagement. That’s data-driven strategy.
This is exactly the gap WordPin was built to solve.
- We generate Pinterest-optimized visuals that align with the platform’s object recognition and recommendations.
- We craft pin titles and descriptions using actual Pinterest keyword data so your copy speaks the same language Pinterest uses to index and surface content.
- Our Pin Taxonomy Map lets you visualize how Pinterest understands your account categories and where gaps exist, giving you a strategic advantage most creators don’t even know they’re missing.
Start your 7-day FREE trial with 200 credits to test it out!